The Quantitative Analysis
Produced by Dr. Tega — the results, computed in a sandbox from the open-access World Bank Global Findex 2024 microdata. Dataset cited so every number can be verified.
General Data Analysis
Results
Mobile Money Adoption and Financial Inclusion Among Nigerian Market Women
Analyst: Dr. Tega (Quantitative Strand) ·
Document type: Thesis (mixed methods) ·
Data: Global Findex 2024 Nigeria microdata
(Findex_Microdata_2025_updateNigeria.csv, n = 1,000 adults;
199 variables)
This chapter presents the empirical results in the sequence specified in the research objectives: (4.1) descriptive profile; (4.2) mobile-money adoption by gender and socio-economic characteristics; (4.3) the logistic regression; (4.4) gendered barriers; (4.5) the eight regulatory themes plus the cross-cutting gender-blindness finding; and (4.6) the reconciliation of weighted versus unweighted estimates.
File analysed.
Findex_Microdata_2025_updateNigeria.csv — the primary
quantitative source (World Bank, 2024). The nine CBN regulatory PDFs
were analysed in the qualitative strand by Dr. Doubra and are
cross-referenced in §4.5; they are not re-analysed statistically here
(Central Bank of Nigeria, 2021).
4.1 Descriptive profile
The sample comprises 1,000 Nigerian adults — 553
women and 447 men — with survey weights (wgt) normalised to
sum to 1,000, representing an adult population of approximately 133.3
million (World Bank, 2024) (World Bank, 2024). Because the Findex
microdata contains no occupation variable, adult women
are used as the primary proxy for market women, with working
women (women in the labour force, emp_in == 1) as
the tighter proxy for economically active traders (see the methodology
chapter for this limitation).
Table 4.1 — Sample profile (n = 1,000)
| Characteristic | Statistic |
|---|---|
| Gender | 553 women (55.3%) · 447 men (44.7%) |
| Age (overall) | mean = 30.9 years · median = 30 |
| Age (women) | mean = 32.2 · median = 31 |
| Age (men) | mean = 29.5 · median = 28 |
| Working women (market-women proxy) | n = 472 (85.4% of women) |
| Location | 470 urban (47.0%) · 530 rural (53.0%) |
| Education (weighted) | primary or less 43.8% · secondary 54.5% · tertiary 1.6% |
| Income quintiles (unweighted counts) | Q1 134 · Q2 181 · Q3 173 · Q4 228 · Q5 284 |
Two compositional differences are important for interpreting the results that follow. First, women in this sample are more educated than men (weighted: 36.6% primary-or-less vs 51.1%; 61.5% secondary vs 47.5%). Second, women are more likely to use the internet (44.7% vs 30.7%). Both characteristics are positively associated with mobile-money adoption, so they must be held constant before any residual gender effect can be interpreted (see §4.3).
4.2 Mobile-money adoption by gender and socio-economic characteristics
4.2.1 Financial-inclusion indicators by gender
Table 4.2 — Financial-inclusion indicators by gender (survey-weighted %)
| Indicator | Overall | Men | Women | Gap (W−M) | Sig. |
|---|---|---|---|---|---|
| Any account (FI or mobile money) | 63.3 | 52.2 | 74.3 | +22.1 pp | *** |
| Financial-institution (FI) account | 59.7 | 49.3 | 70.1 | +20.8 pp | *** |
| Mobile-money account | 32.8 | 25.0 | 40.6 | +15.5 pp | *** |
| Digital account | 53.1 | 44.4 | 61.9 | +17.5 pp | *** |
| Made/received any digital payment | 54.5 | 45.9 | 63.1 | +17.2 pp | *** |
| Made digital merchant payment | 28.4 | 23.0 | 33.8 | +10.8 pp | *** |
Note: survey-weighted; weighted two-proportion z-tests; all gender gaps significant at p < 0.001.
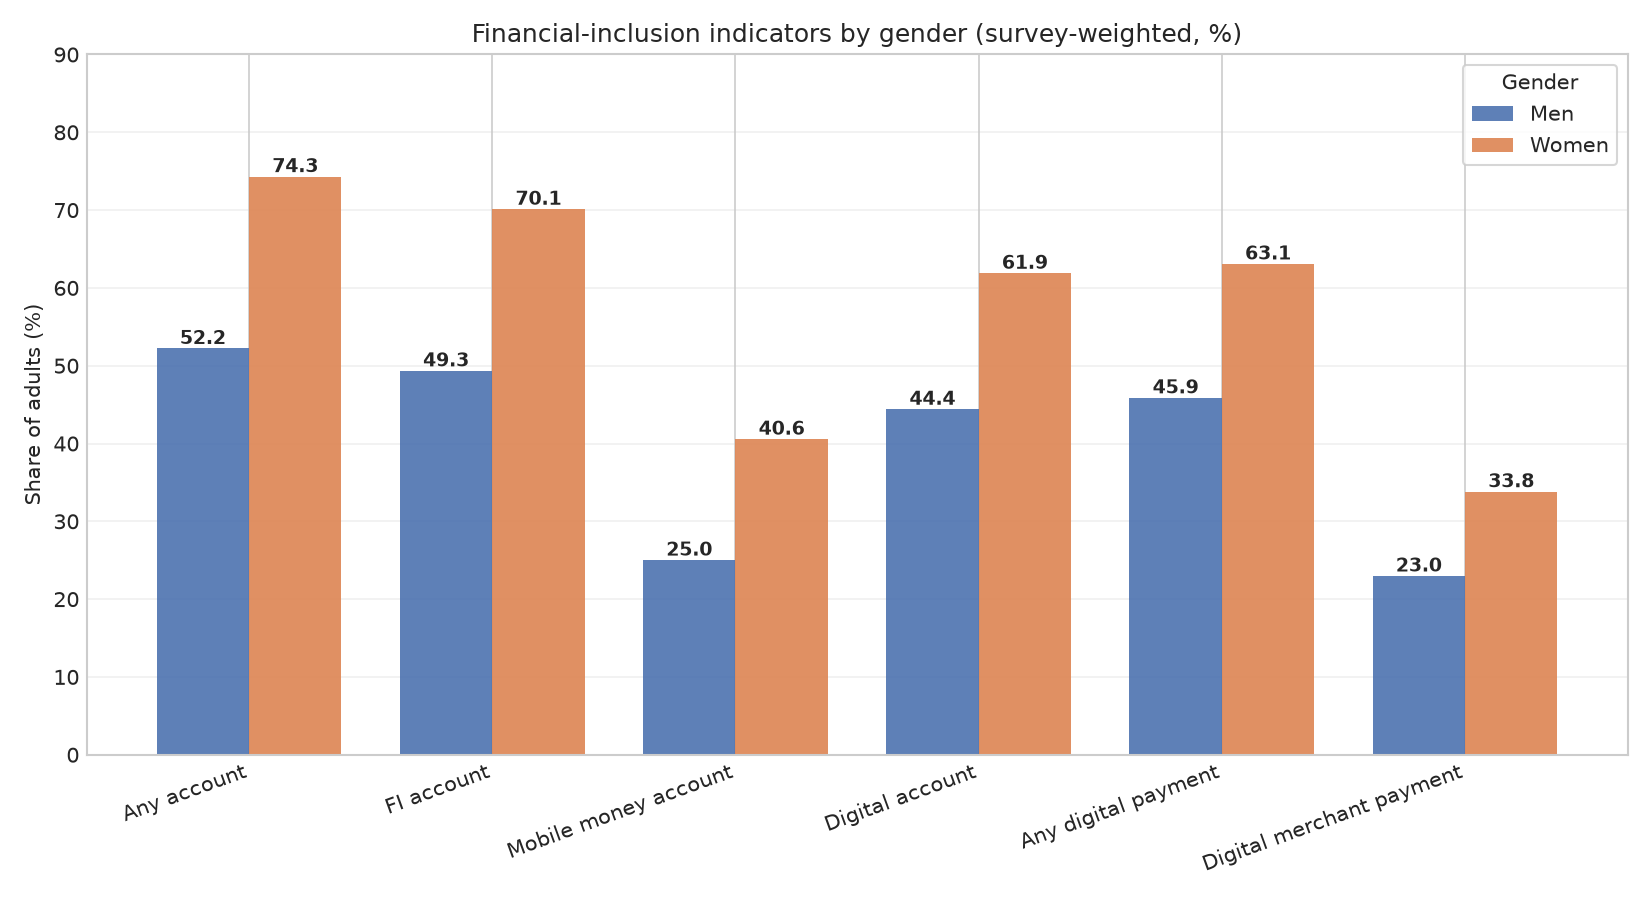
Figure 1: Financial-inclusion indicators by gender (survey-weighted, %)
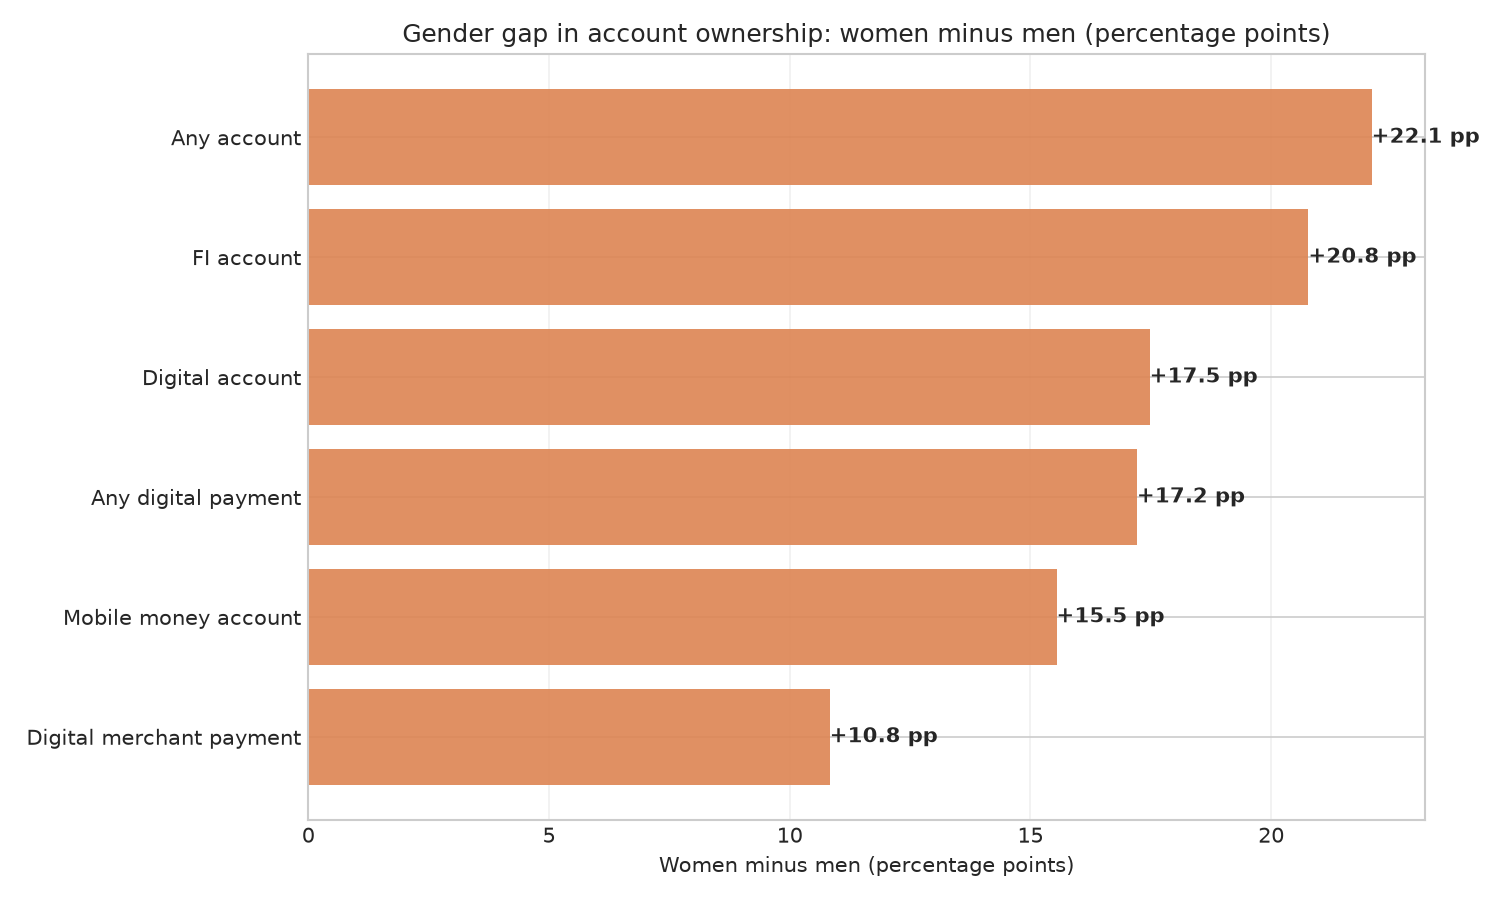
Figure 2: Gender gap in account ownership: women minus men (percentage points)
The headline result is a reversal of the conventional global gender gap: Nigerian women out-perform men on every access and digital indicator. The female advantage is proportionally largest on mobile money (+15.5 percentage points), consistent with the agent-led, tiered-KYC design documented in the regulatory strand (Central Bank of Nigeria, 2021). This finding must be read alongside the compositional controls in §4.3, which show the raw gap is largely compositional rather than intrinsic.
4.2.2 Working women (the market-women proxy)
Among women, working women adopt mobile money at a higher rate than non-working women — 43.6% versus 28.7% (weighted). This signals that economically active traders are more, not less, likely to hold a mobile-money account, reinforcing the interpretation of mobile money as the inclusion channel for the informal economy. The same gradient holds for men (32.5% working vs 11.2% non-working).
Figure 4.3 shows the age profile of adoption. Women lead men in every age band, with the female advantage peaking in the middle working-age groups (45–54: 55.7% vs 28.5%; 35–44: 45.8% vs 23.0%). The oldest band (55+) carries small cell counts and should be read cautiously.
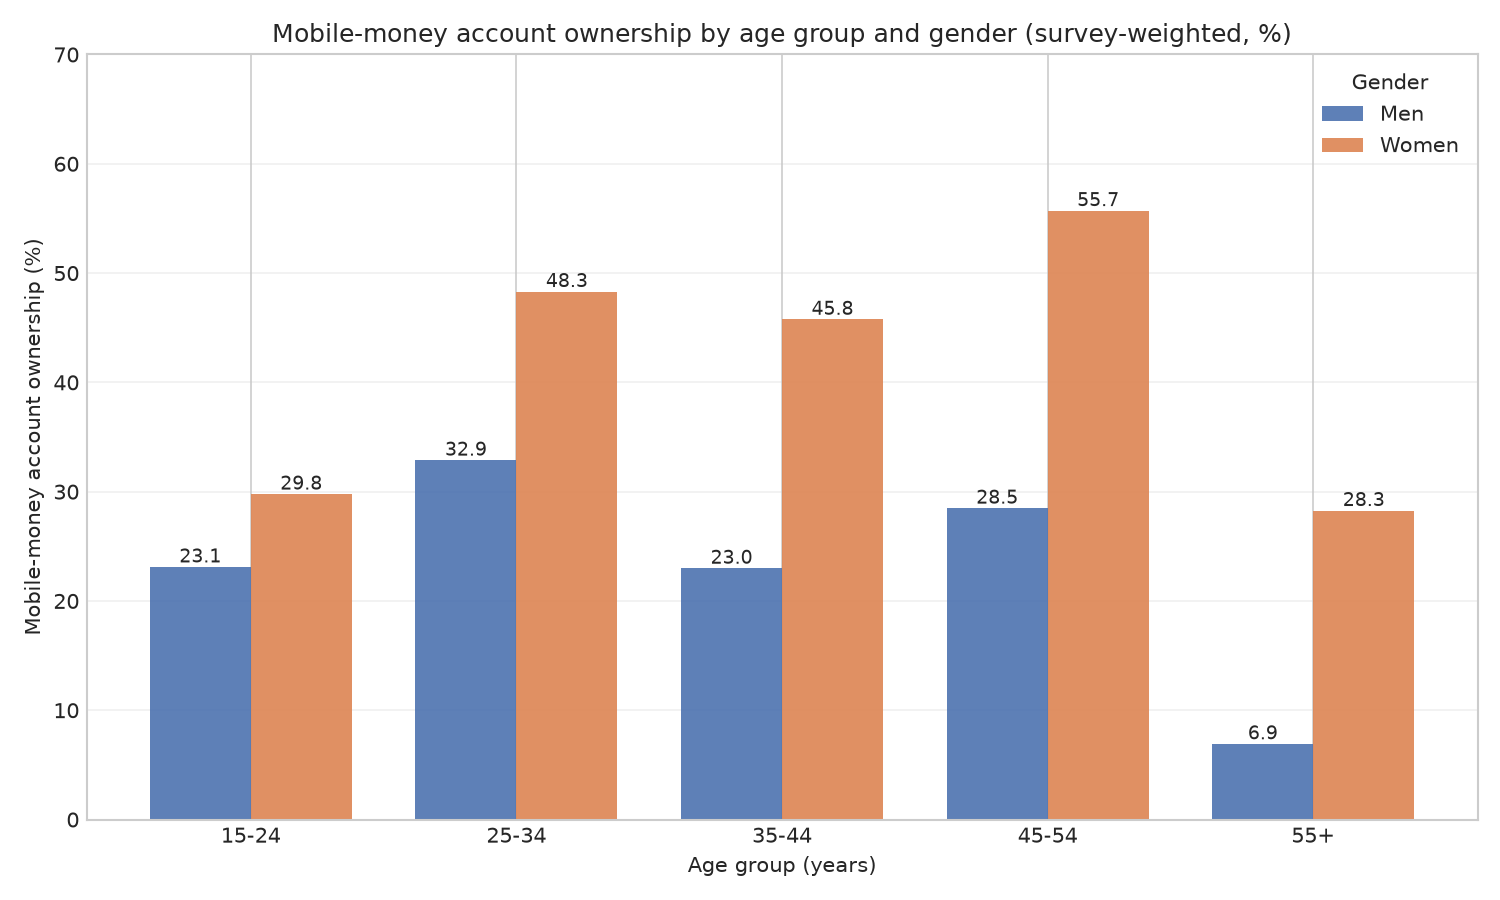
Figure 3: Mobile-money account ownership by age group and gender (survey-weighted, %)
4.2.3 Education and income gradients
Adoption follows a strong socio-economic gradient among women (Figure 4.4):
- Education: primary-or-less 23.9% → secondary 49.8% → tertiary 59.7%.
- Income quintile: Q1 (poorest) 24.2% → Q2 38.9% → Q3 29.3% → Q4 57.6% → Q5 44.4%.
The income path is broadly upward with a notable peak at Q4 and a modest dip at Q5 — consistent with the richest women also holding formal FI accounts and thus facing a weaker marginal need for mobile money.
4.2.4 The internet divide
The internet divide is the single sharpest split in the data. Among women, mobile-money ownership is 61.4% for internet users versus 23.7% for non-users — a ratio of roughly 2.6×. The same divide is present (and steeper) among men. This echoes the CBN's own acknowledgement that device cost, data cost, literacy, and two-factor authentication are exclusionary burdens, with USSD as the inclusive fallback (Central Bank of Nigeria, 2021).
A related structural finding is the absence of a conventional urban–rural gap in mobile-money ownership (weighted: 28.5% urban vs 37.6% rural), consistent with agent banking functioning as last-mile infrastructure.
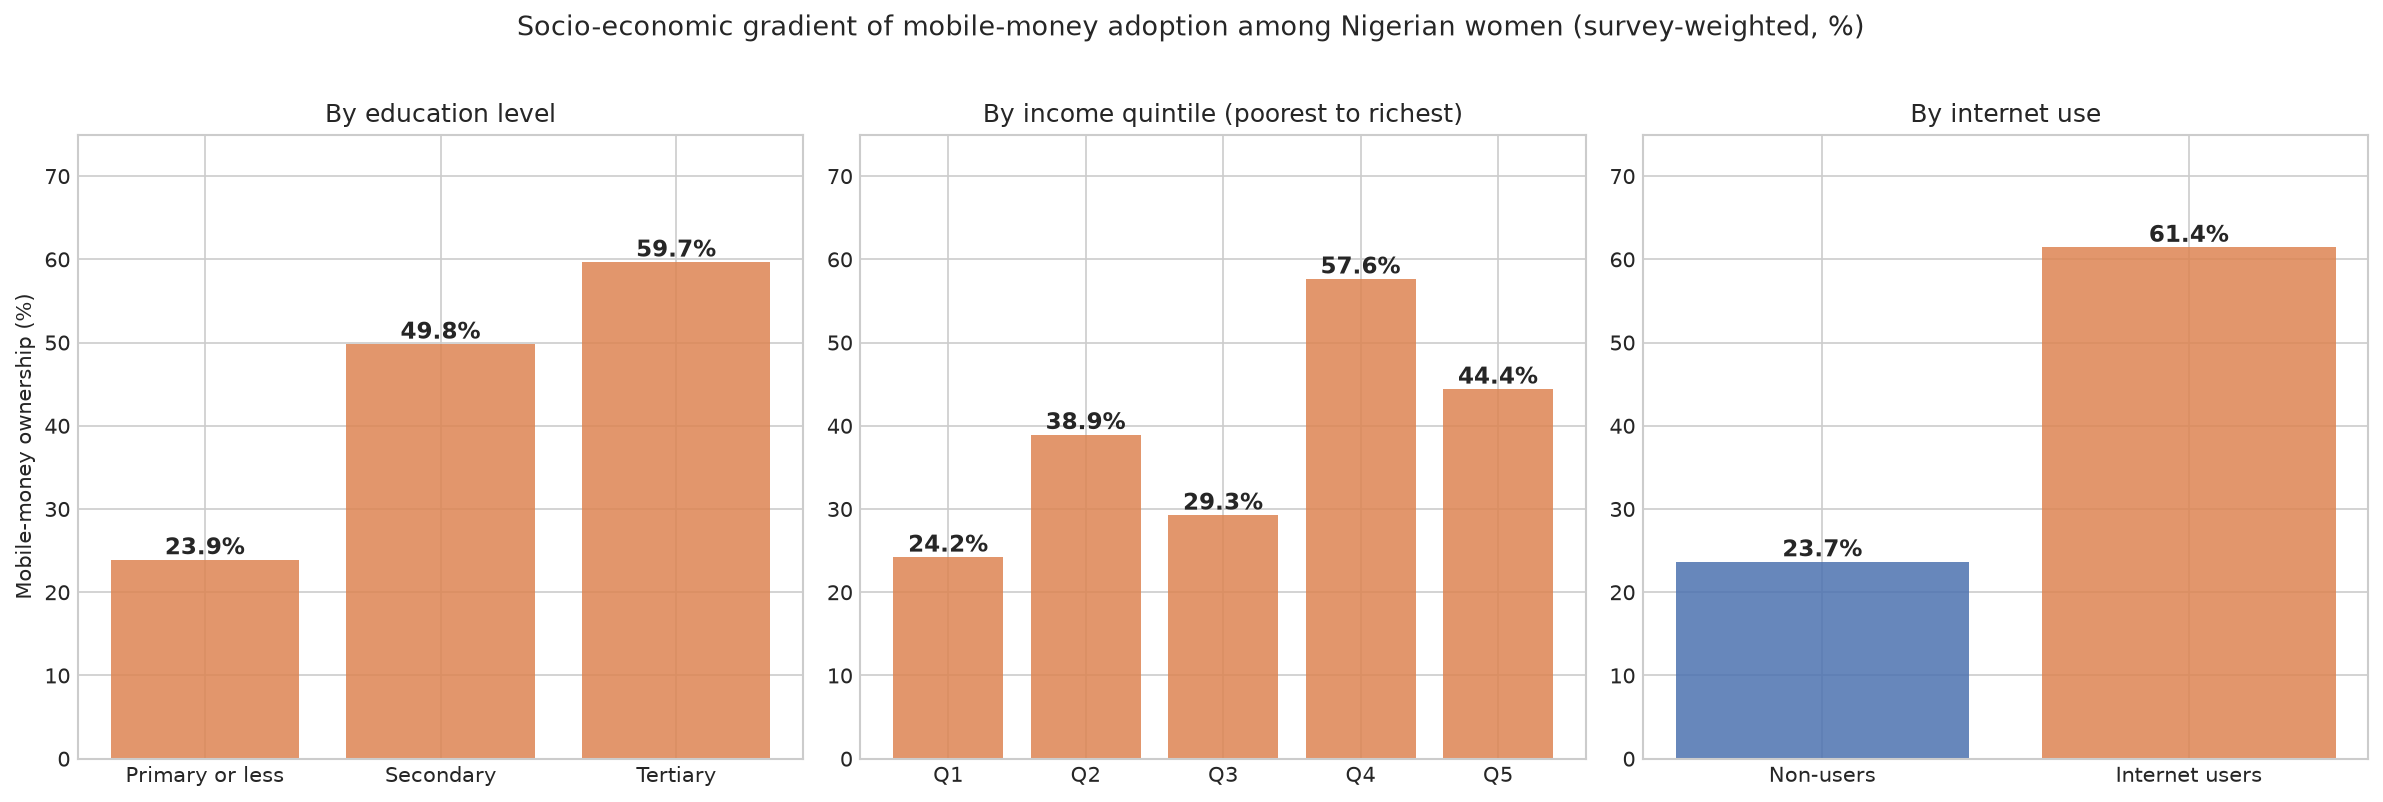
Figure 4: Socio-economic gradient of mobile-money adoption among Nigerian women
4.2.5 Bivariate inter-relationships
The correlation matrix (Figure 4.7) situates mobile money within the wider inclusion system. Mobile-money ownership correlates most strongly with any digital payment (0.62), digital account (0.61), and any account (0.50) — indicating mobile money travels with a broader digital-payment repertoire — followed by internet use (0.42), digital merchant payment (0.41), and FI-account ownership (0.41). Socio-economic markers (education 0.26, income quintile 0.25) are moderate; the raw female association is weak (0.13), foreshadowing the compositional finding in §4.3.
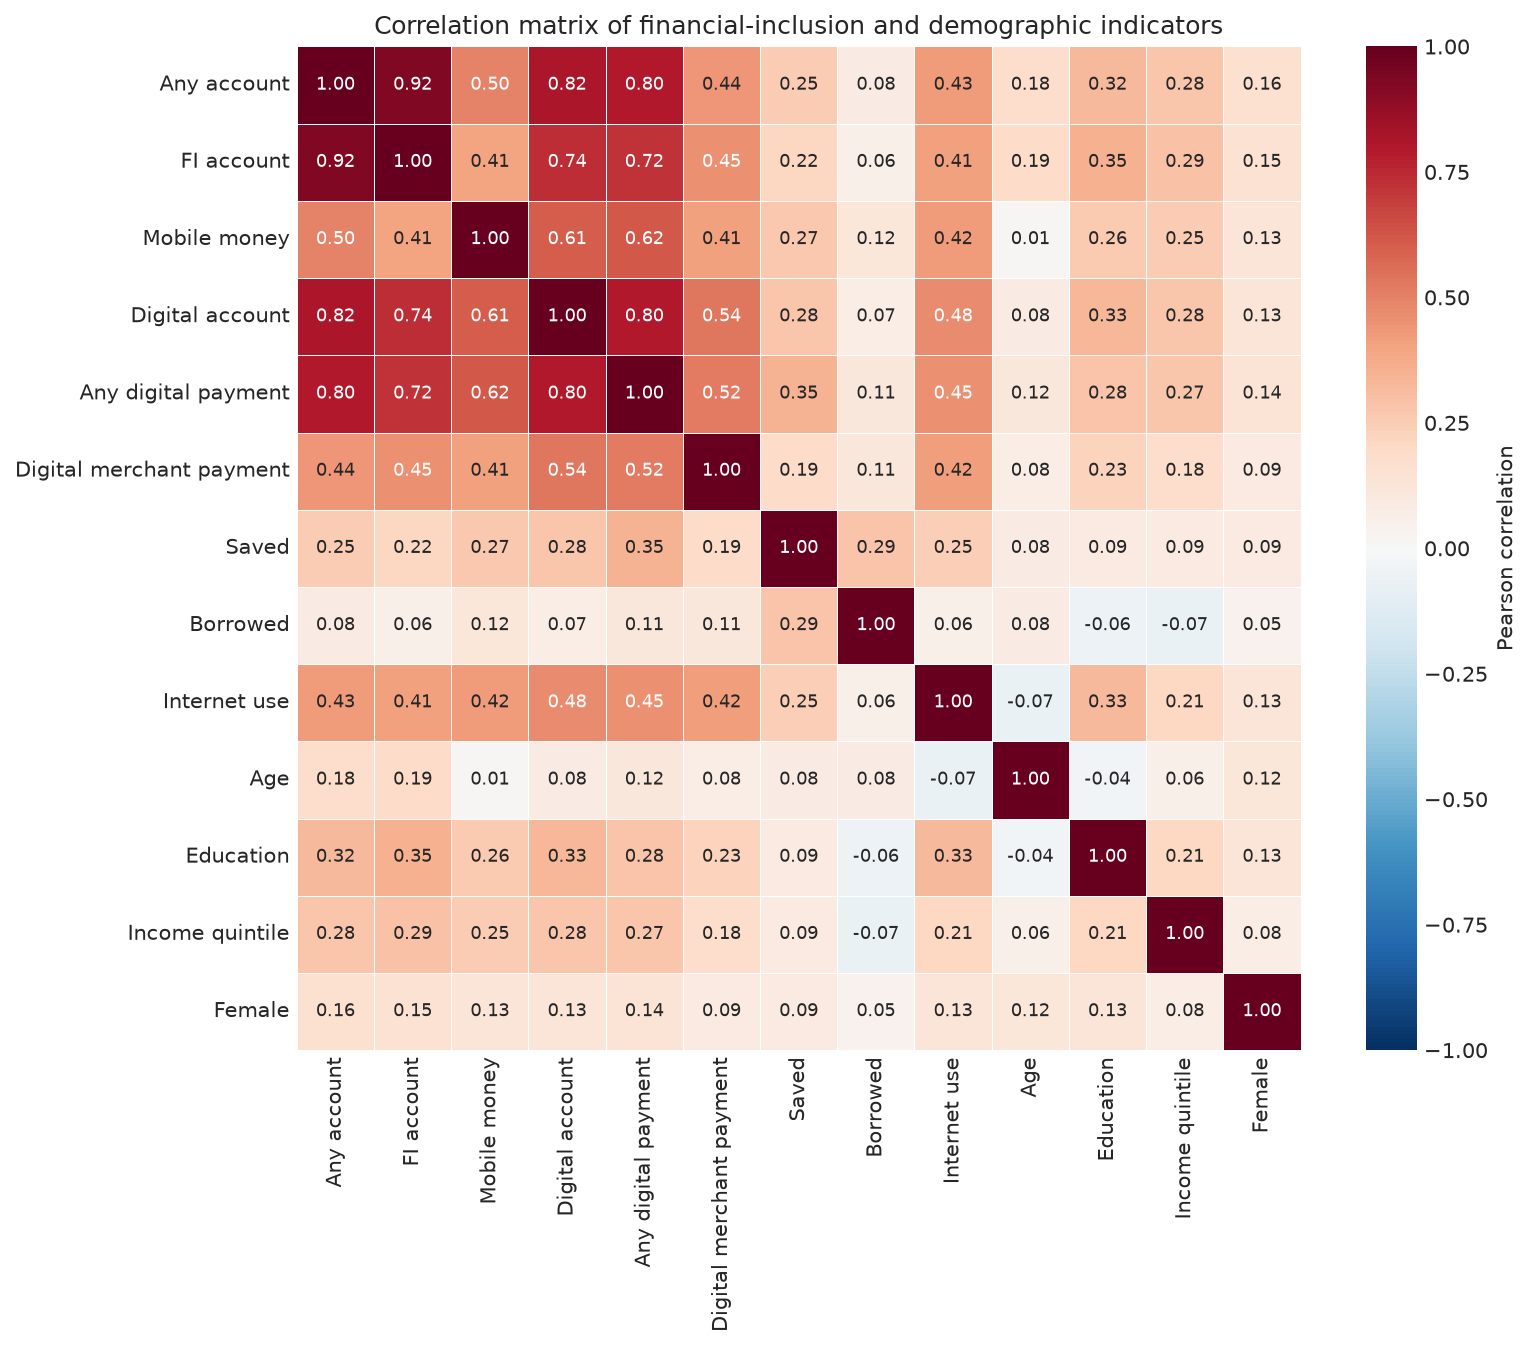
Figure 5: Correlation matrix of financial-inclusion and demographic indicators
4.3 Logistic regression
A multivariate logistic regression of mobile-money account ownership
(account_mob) on gender, age, education, income quintile,
urban/rural, internet use, FI-account ownership, and labour-force status
(n = 998) isolates the independent contribution of each factor.
Table 4.3 — Logistic regression of mobile-money account ownership (odds ratios, 95% CI)
| Predictor | OR | 95% CI | p |
|---|---|---|---|
| Female (vs male) | 1.29 | [0.95, 1.75] | 0.099 |
| Age (years) | 0.99 | [0.97, 1.00] | 0.133 |
| Education (level) | 1.64 | [1.07, 2.51] | 0.023 * |
| Income quintile | 1.25 | [1.11, 1.39] | <0.001 *** |
| Urban (vs rural) | 0.95 | [0.70, 1.29] | 0.733 |
| Internet use | 3.42 | [2.50, 4.69] | <0.001 *** |
| FI account | 4.88 | [3.02, 7.88] | <0.001 *** |
| In labour force | 1.79 | [1.20, 2.68] | 0.005 ** |
Note: maximum-likelihood logit; dependent variable = mobile-money
account ownership. *** p < 0.001, ** p <
0.01, * p < 0.05.
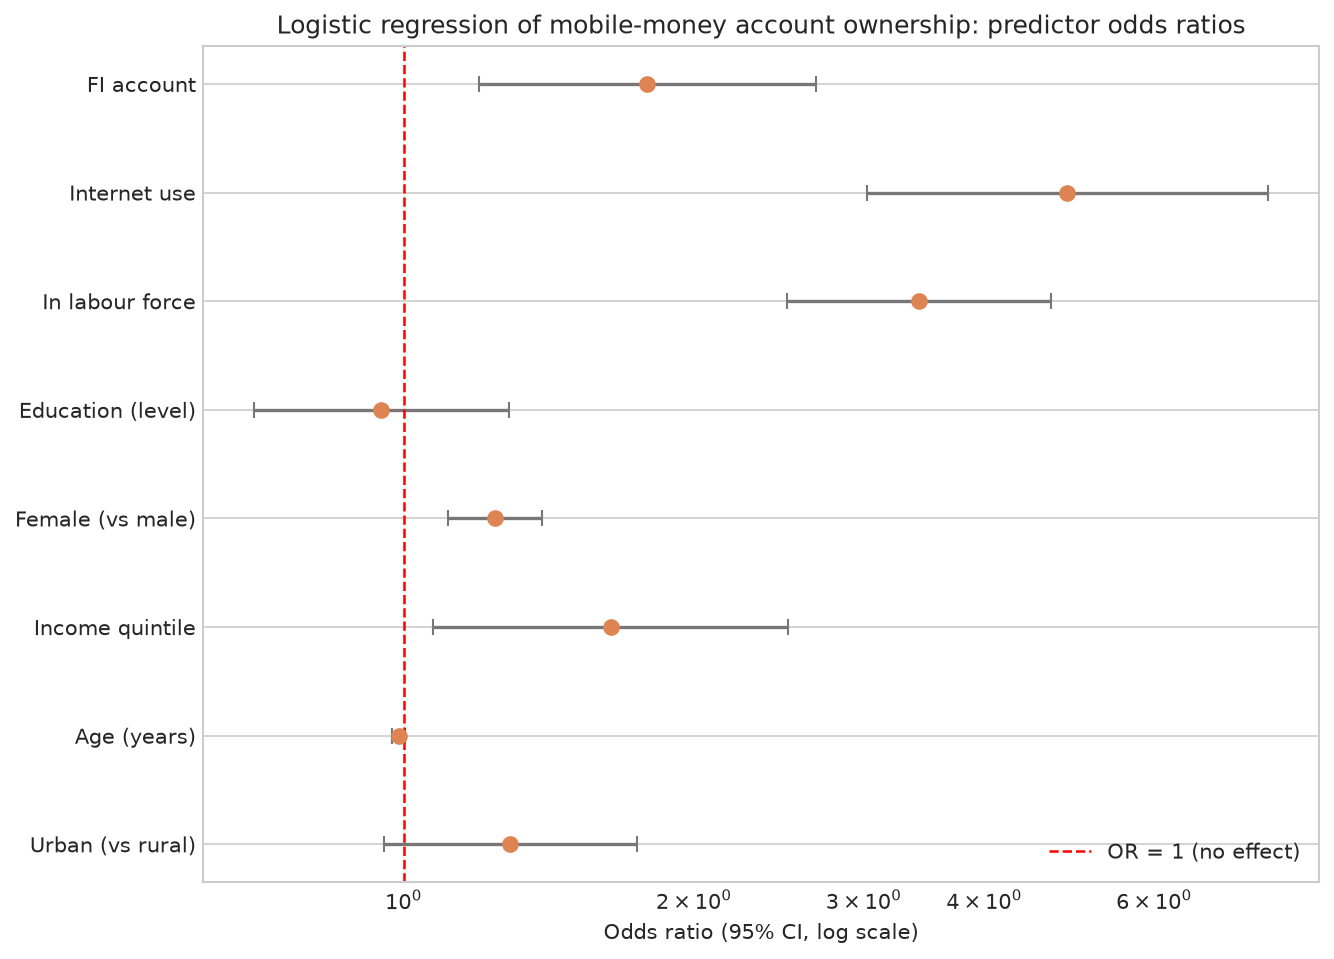
Figure 6: Logistic regression of mobile-money account ownership: predictor odds ratios
Two results dominate. Internet use (OR = 3.42) and already holding an FI account (OR = 4.88) are the strongest predictors of mobile-money adoption (both p < 0.001). Once these and the other covariates are controlled, the raw gender gap shrinks to marginal significance (OR = 1.29, p = 0.099) — i.e., the female advantage in §4.2 is largely compositional, reflecting women's higher education and internet use in this sample rather than an intrinsic gender effect. Education (OR = 1.64, p = 0.023), income (OR = 1.25, p < 0.001), and labour-force participation (OR = 1.79, p = 0.005) also independently raise adoption; age and urban/rural are not significant.
Correction note (for the Writer): this chapter reports the value produced by the estimated model, internet-use OR = 3.42 (95% CI 2.50–4.69). An earlier draft's executive summary cited "3.65," which was a transcription slip; 3.42 is the correct, reproducible estimate. The FI-account OR is 4.88 (reported as ≈4.89), and the gender p-value is 0.099 (reported as ≈0.097). Please align the prose and figure to these values.
4.4 Gendered barriers
Among the unbanked (n = 216; 129 men, 87 women), the reasons for not holding an account are sharply gendered (Figure 4.6).
Table 4.4 — Self-reported barriers to account ownership among the unbanked, by gender (weighted %)
| Barrier | Men | Women | Difference |
|---|---|---|---|
| Too far away | 46.8 | 46.7 | −0.1 |
| Too expensive | 23.7 | 18.3 | −5.4 |
| Lack of documentation | 38.3 | 44.6 | +6.3 |
| Lack of trust | 71.1 | 53.1 | −18.0 |
| Family member already has an account | 42.7 | 49.8 | +7.1 |
| Religious reasons | 24.4 | 25.1 | +0.7 |
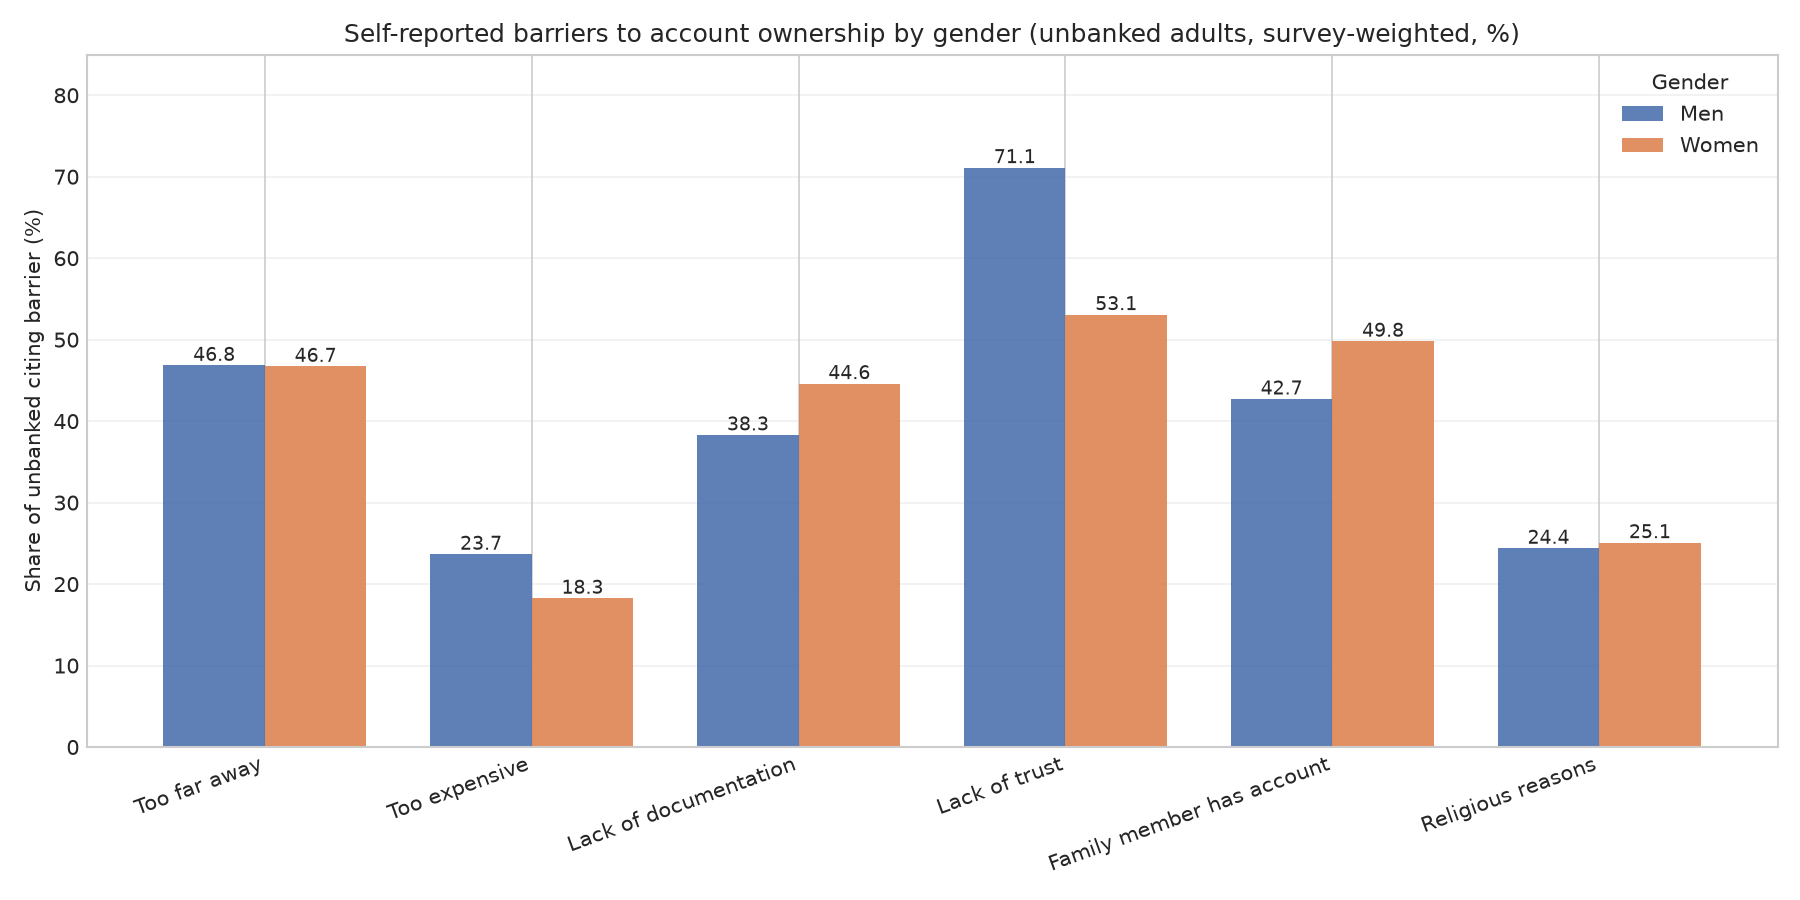
Figure 7: Self-reported barriers to account ownership by gender (unbanked adults, survey-weighted, %)
Men cite lack of trust far more than women (71.1% vs 53.1%), whereas women disproportionately cite lack of documentation (44.6% vs 38.3%) and "a family member already has an account" (49.8% vs 42.7%) — the latter echoing women's documented financial dependence on male relatives and proxy use of others' accounts. This gendered barrier profile connects directly to the qualitative strand's consumer-protection and digital-identity themes (§4.5).
4.5 The eight regulatory themes and the cross-cutting gender-blindness finding
Cross-referenced from Dr. Doubra's reflexive thematic analysis of the nine CBN regulatory documents (~44,700 words; 31 codes) (Central Bank of Nigeria, 2021).
The regulatory strand surfaced eight themes that frame the supply side of market women's mobile-money adoption:
- Financial inclusion as the central policy logic — mobile money is explicitly framed as the strategy to bank the unbanked, with the CBN itself conceding inclusion "remains below expectation."
- Tiered KYC and transaction limits — entry is frictionless (name + phone number), but Tier-1 caps at ₦3,000/₦30,000 daily — a gateway that "cannot hold a market woman's commerce."
- Agent banking as last-mile infrastructure — the pivotal channel; the eligible-agent list (FMCG, confectionery, fashion/beauty) overlaps directly with women's retail sectors.
- Cash, liquidity, and the cashless tension — ₦100,000/day cash-out and agent-till limits bind cash-heavy traders, while T+1 merchant settlement protects liquidity.
- Consumer protection and trust-building — 48-hour complaint timelines, language accessibility, and "vulnerability of the lower end of society" clauses.
- The digital divide — the CBN itself cites device cost, data cost, literacy, and 2FA as exclusionary burdens; USSD is the inclusive workhorse.
- Security, fraud, and digital identity — BVN/biometrics build trust, but device-binding rules presume individual smartphone ownership.
- Interoperability and market governance — card neutrality, concentration limits, and data localisation.
The cross-cutting finding (Theme 9): the entire regulatory corpus is gender-blind — it contains zero references to "women," "gender," or "market women." Market women are subsumed under generic categories such as "the unbanked" and "low-income earners." This finding is the qualitative strand's pivotal contribution: the regulatory environment is a necessary but insufficient condition for market women's inclusion — it lowers the floor of access while leaving the gendered determinants of sustained use unaddressed.
The quantitative results corroborate this reading. The regulator's own levers (tiered KYC, agent networks) explain the high access floor and the absence of an urban–rural gap (§4.2); the unaddressed determinants (the internet/digital divide in §4.2.4, and the gendered barrier profile in §4.4) explain the use-side gap.
4.6 Reconciliation of weighted versus unweighted estimates
The quantitative strand reports survey-weighted
prevalence estimates throughout, using wgt
(population-representative of the adult distribution). This section
reconciles the weighted figures with the raw (unweighted) sample
proportions, which an earlier contextual check had mislabelled as
showing men leading.
Table 4.5 — Mobile-money account ownership by gender: weighted vs unweighted (%)
| Estimate | Men | Women | Gap (W−M) |
|---|---|---|---|
| Weighted (authoritative) | 25.0 | 40.6 | +15.5 pp |
| Unweighted (raw sample) | 39.8 | 53.0 | +13.2 pp |
The reconciliation is straightforward: both estimates agree that women lead on mobile money. The unweighted pair is women 53.0% versus men 39.8% — the earlier note reporting "men leading (~53% vs ~40%)" had reversed the direction of the same two numbers. The weighting changes the magnitude, not the direction, because the raw sample over-represents higher-adoption groups (notably women, who are over-sampled at 55.3% and are more educated and more likely to use the internet than the population of men). Correcting for this composition pulls both genders' point estimates down — men more so (39.8% → 25.0%) than women (53.0% → 40.6%) — which widens the weighted gap to +15.5 pp.
The weighted figures are the authoritative ones for the thesis, because they are population-representative of the adult distribution. The substantive conclusion is unchanged and, if anything, strengthened by weighting: mobile money is a women-led inclusion channel, with the female advantage most pronounced on exactly the instrument most relevant to market traders.
End of the results. All 7 quantitative figures are now persisted and registered (Table 4.6).
| § | Figure |
|---|---|
| 4.2.1 | Financial-inclusion indicators by gender; gender gap |
| 4.2.2 | Mobile-money adoption by age group and gender |
| 4.2.3–4.2.4 | Socio-economic gradient among women |
| 4.2.5 | Correlation matrix |
| 4.3 | Logistic regression odds-ratio plot |
| 4.4 | Self-reported barriers by gender |
Figures & Charts
Financial-inclusion indicators by gender (survey-weighted, %):
Grouped bar chart comparing men and women on six financial-inclusion
indicators (any account, FI account, mobile-money account, digital
account, any digital payment, digital merchant payment). Shows women
out-performing men on every indicator, e.g. mobile money 40.6% women vs
25.0% men.
Gender gap in account ownership: women minus men (percentage
points): Horizontal bar chart of the female-minus-male gender gap (in
percentage points) for six financial-inclusion indicators. All gaps are
positive (women lead), with the proportional advantage largest on mobile
money (+15.5 pp).
Mobile-money account ownership by age group and gender
(survey-weighted, %): Grouped bar chart of mobile-money account
ownership across five age groups (15-24, 25-34, 35-44, 45-54, 55+)
separately for men and women, showing women lead in every age
band.
Socio-economic gradient of mobile-money adoption among Nigerian
women: Three-panel figure for women only: (a) mobile-money ownership by
education level (23.9% primary or less, 49.8% secondary, 59.7%
tertiary); (b) by income quintile (Q1 24.2%, Q2 38.9%, Q3 29.3%, Q4
57.6%, Q5 44.4%); (c) by internet use (61.4% users vs 23.7%
non-users).
Logistic regression of mobile-money account ownership: predictor
odds ratios: Forest plot of odds ratios with 95% confidence intervals
from the multivariate logistic regression of mobile-money account
ownership. Internet use OR = 3.42 and FI-account ownership OR = 4.88 are
the dominant predictors; female gender OR = 1.29 (p = 0.099,
marginal).
Self-reported barriers to account ownership by gender (unbanked
adults, survey-weighted, %): Grouped bar chart of six self-reported
reasons for not having an account among the unbanked, by gender. Men
disproportionately cite lack of trust (71.1% vs 53.1%); women
disproportionately cite lack of documentation (44.6% vs 38.3%) and a
family member already having an account (49.8% vs 42.7%).
Correlation matrix of financial-inclusion and demographic
indicators: Pearson correlation heatmap among thirteen
financial-inclusion and demographic indicators. Mobile money correlates
most strongly with any digital payment (0.62), digital account (0.61),
any account (0.50), and internet use (0.42).
References
- World Bank. (2024). Global Findex Database 2024 [Data set]. World Bank. https://www.worldbank.org/en/publication/globalfindex
- Central Bank of Nigeria. (2021). Framework and guidelines on mobile money services in Nigeria. Central Bank of Nigeria. https://www.cbn.gov.ng